> ## Documentation Index
> Fetch the complete documentation index at: https://docs.ctxprotocol.com/llms.txt
> Use this file to discover all available pages before exploring further.
# Grounded vs. Synthetic: One Question, Two Answers
> The same hard BTC order-flow question, sent to a top frontier model with no tools and to Context's grounded pipeline. The two verdicts disagree because one of them invented the data.
Free LLMs are smart. But when a question needs **live market data they can't
see**, they don't refuse. They confidently fill in the numbers and answer
anyway.
Below is the *same* question sent two ways: to a top frontier model (Gemini 3.1
Pro, no tools) and to Context's grounded pipeline. Read the two verdicts. They
disagree, and the reason they disagree is the entire point of Context.
**Verdict: SHORT SQUEEZE (bullish reversal)**
Built on the prompt's assumption that OI was *climbing*. Returned a
plausible narrative plus a 100-line Python script for *you* to run on
*your own* Crypto Data feed. No live numbers. No chart.
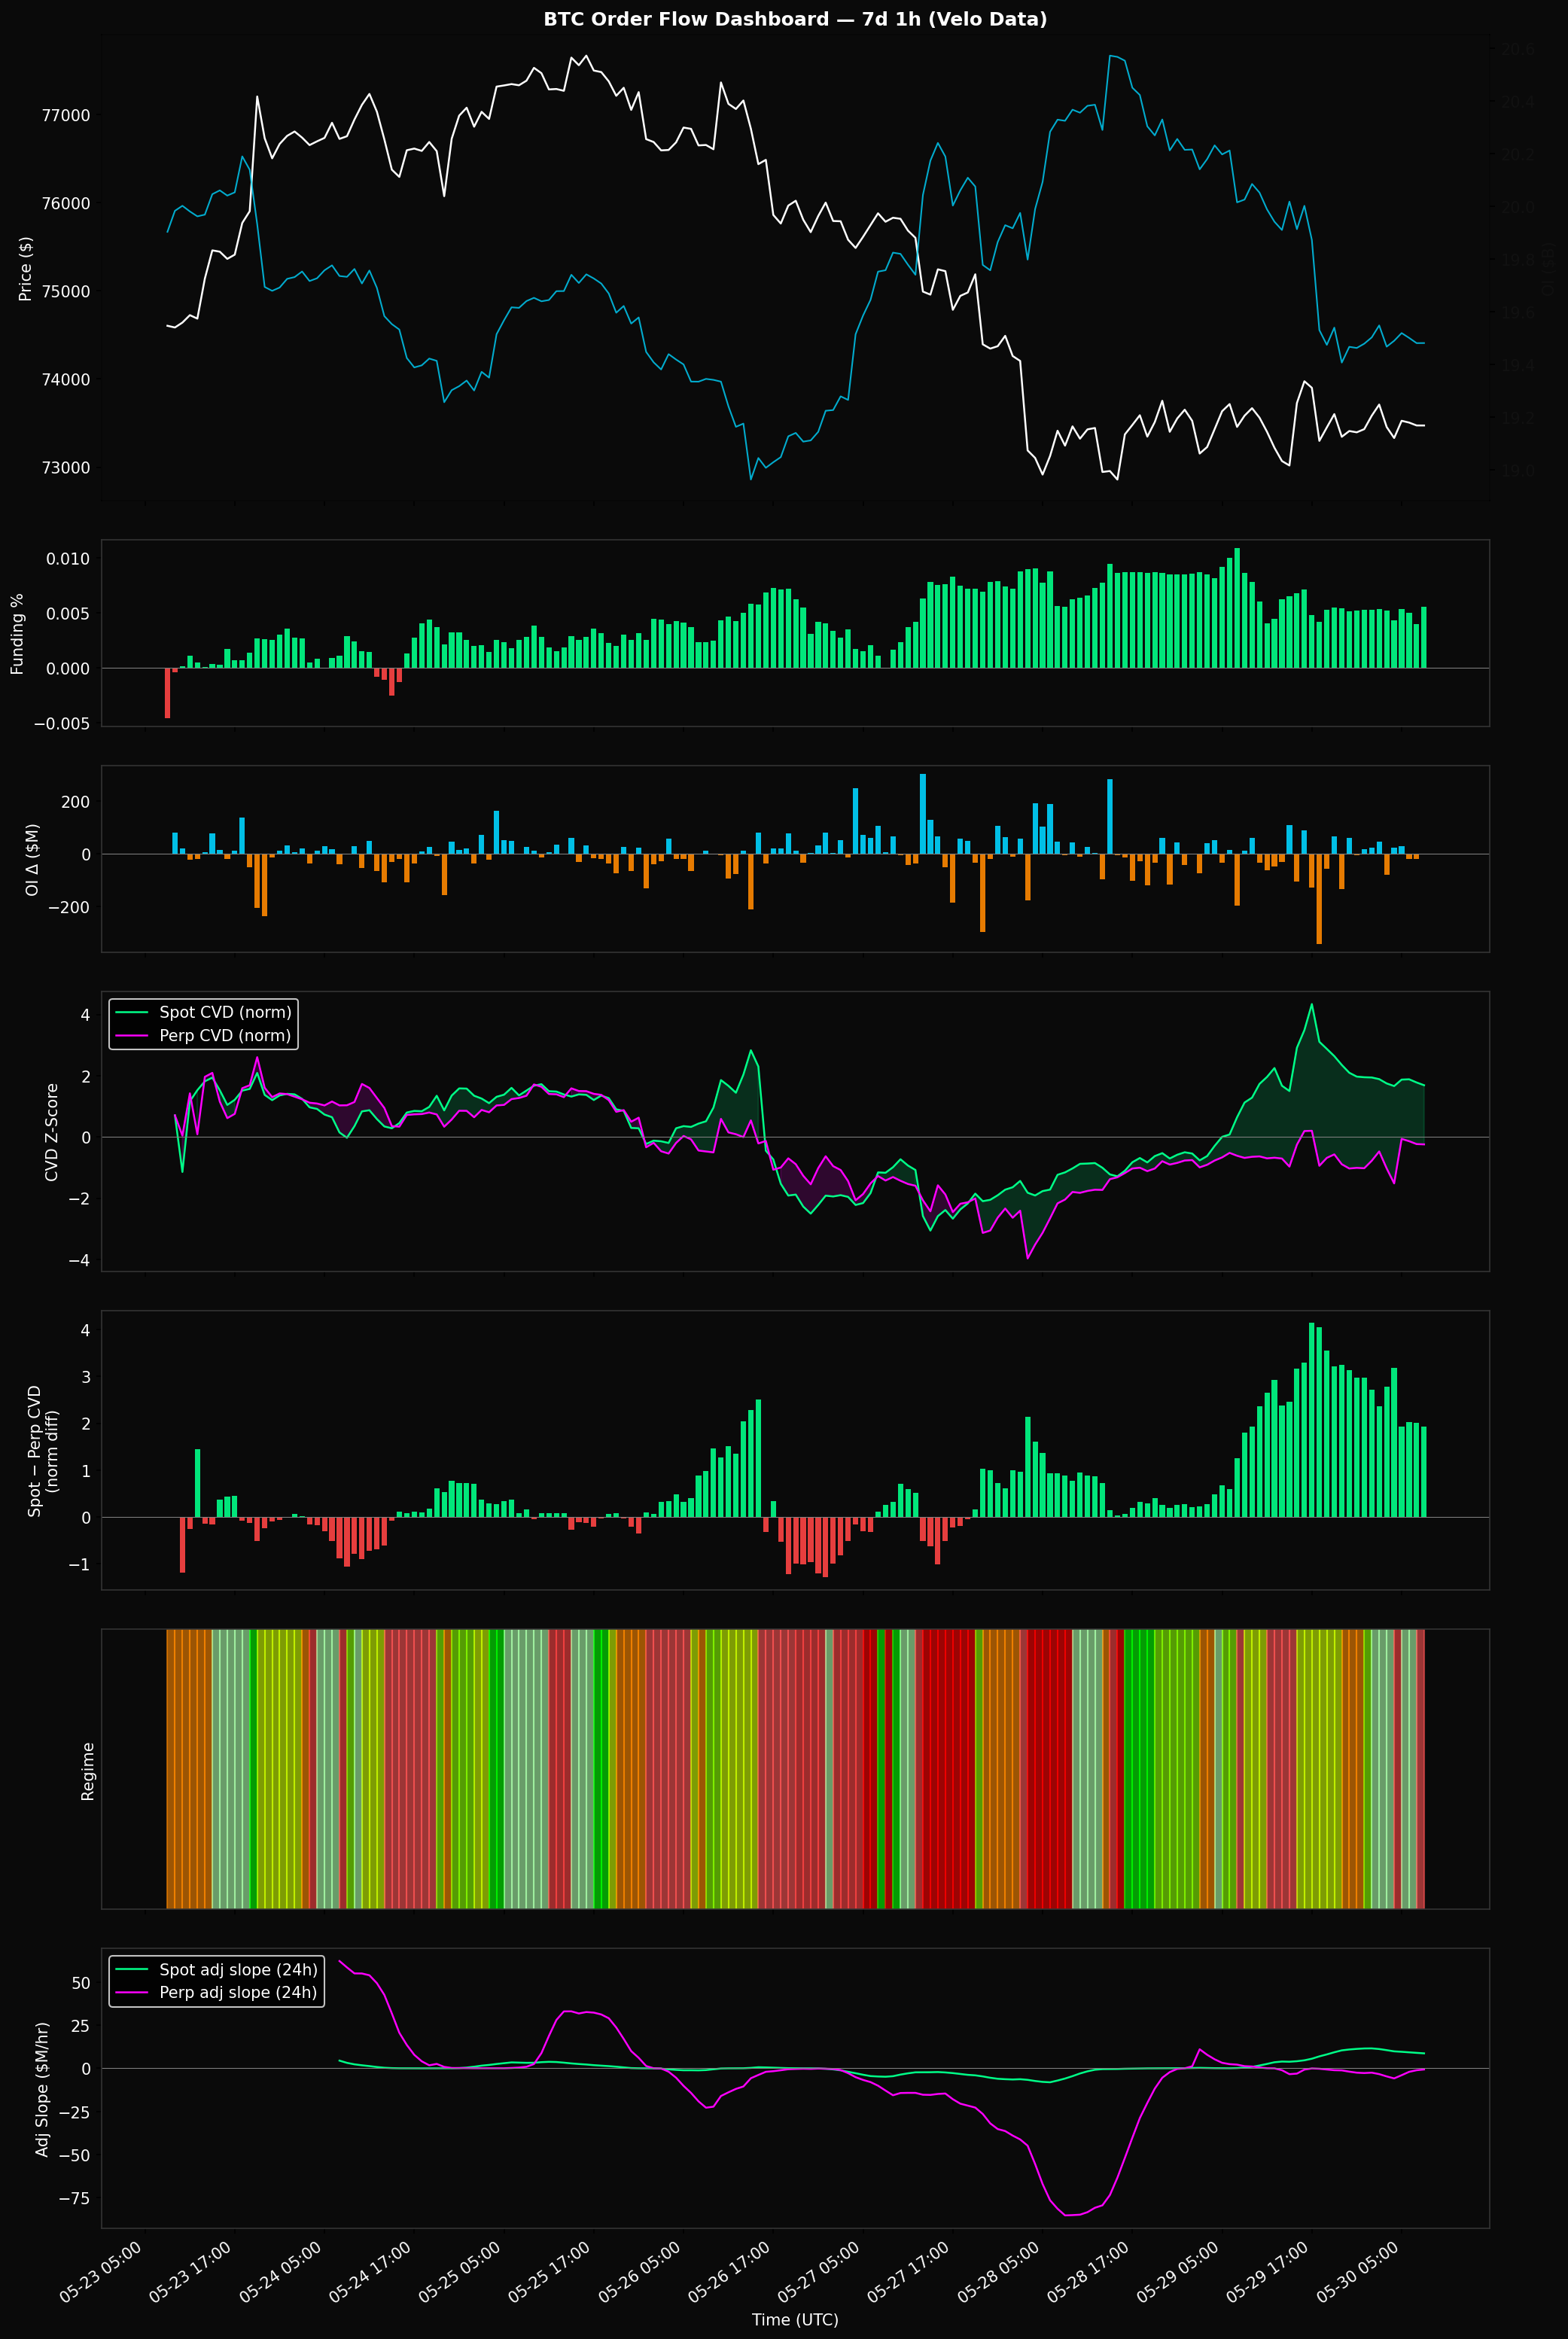
**Verdict: Neutral / Mixed**
Built from the live 7-day Crypto Data feed. Open interest was actually
*contracting* **−4.35%**. Returns the rendered dashboard, the exact
metrics, and a grounded trade read.
The frontier model assumed open interest was climbing, because that is how
the prompt framed it. Context checked the live feed and found OI had **fallen
4.35%** over the same window. That one invented premise flips the whole trade
verdict from "bullish short squeeze" to "neutral, wait-and-confirm."
***
## The question
A single, demanding BTC order-flow prompt: aggregate funding and open interest
across all exchanges over 7 days at 1h granularity, overlay price, run rolling
CVD regressions, classify the regime with the OI matrix, scan for absorption,
and deliver one dashboard plus a trade verdict.
```text theme={null}
Please read the order flow for me on BTC. Using Crypto Data over the last 7 days
at 1h granularity, aggregate funding rate and open interest across all
exchanges; overlay BTC 1h close on the same timeline so price action reads
against positioning. Chart funding and OI with hourly delta histograms
underneath so the recent 48h funding dip and steady OI climb are obvious. Add
aggregated spot CVD and aggregated perp CVD at the same 1h cadence and window:
normalize each for relative strength on a rolling basis, then chart the
difference in normalized relative strengthening between spot and perps. For
each CVD leg (spot and perp), run rolling linear regression on bar index versus
CVD level over 24h and 48h lookbacks. Plot slope, R², and adjusted slope =
slope × R² as time series so trend direction, trend quality, and how
aggressively each leg is accumulating are visible. Classify the regime with the
open-interest matrix: price rising/falling × OI rising/falling × volume
rising/falling. Layer CVD absorption (uptrend absorption = bearish; downtrend
absorption = bullish), check spot and perp CVD separately, map the combined
read to who is trapped, and from funding sign and liquidation imbalance deliver
one dashboard chart plus a clear trade-setup verdict.
```
***
## A · Gemini 3.1 Pro, no tools
With no access to the live feed, the model **accepted the prompt's framing**
("steady OI climb") and reasoned from there. It produced a confident,
well-structured analysis, and then handed back a Python engine for you to run
yourself, because it never had the data.
> **Trade-Setup Verdict: SHORT SQUEEZE (Bullish Reversal)**
>
> With negative funding, rising OI, and bullish downtrend absorption confirmed,
> the market is primed for a violent short squeeze. \[…] **Who is trapped? New
> Shorts.**
Notice what is missing: no real funding value, no real OI delta, no liquidation
figure, no rendered chart. The conclusion rests entirely on the assumption that
OI was rising.
The model returned a multi-section narrative followed by a complete
`pandas` / `scipy` / `matplotlib` script (roughly 100 lines) ending with:
```python theme={null}
# To run: generate_orderflow_dashboard(crypto_data_btc_df)
```
In other words: *here is the code to build the dashboard once you've sourced and
cleaned the Crypto Data yourself.* The model can describe the method perfectly. It
cannot fetch the data or produce the chart.
***
## B · Context, grounded
Context ran the live pipeline against the real Crypto Data feed, computed every metric
the prompt asked for, and returned the **rendered dashboard** plus exact
numbers.
 ### The real 48-hour metrics
| Metric | Value |
| ------------------------- | ---------------------------------- |
| 48h price change | **+0.01%** (effectively flat) |
| 48h OI change | **−4.35%** (contracting) |
| Avg funding (48h) | **+0.0069%** / 8h |
| Latest funding | **+0.0056%** / 8h |
| Liquidation imbalance | **−\$219M** (sell liqs ≫ buy liqs) |
| Spot CVD adj. slope (24h) | **+\$8.67M/hr** |
| Perp CVD adj. slope (24h) | **−\$0.66M/hr** |
### The grounded read
* **Regime (OI matrix):** flat price + falling OI + below-average volume lands
on **weak uptrend / short-covering**, not the new-money strong uptrend a
bullish squeeze would need.
* **Absorption:** spot CVD trending up (+\$8.67M/hr) while perp CVD is
flat-to-negative = real **spot absorption** of perp-driven selling.
* **Who's trapped:** earlier shorts are under pressure (−\$219M sell-liq
imbalance, funding still positive), but mid-week longs are exposed because OI
is *declining*, so no fresh margin confirms the move.
> **Verdict: Neutral / Mixed: lean cautiously bullish on absorption, but wait
> for confirmation.** Watch for a reclaim of local highs with *simultaneous OI
> expansion* and funding dipping toward zero. Until then, this is a
> wait-and-confirm environment, not a high-conviction entry.
*Data: Crypto Data, 7-day 1-hour aggregate across Binance, Bybit, OKX,
Hyperliquid, Deribit (perps) and Binance, Bybit Spot, OKX, Coinbase (spot).*
***
## What this shows
Gemini had no feed, so it trusted the prompt's "steady OI climb" and built a
bullish squeeze thesis on top of it. The reasoning was clean; the foundation
was assumed.
Context pulled the live data, found OI was actually down 4.35%, and the
verdict changed. The data is the deliverable, including the chart you can
act on.
***
## Try it yourself
The grounded answer above came from the same public SDK surface your agent can
hit today. Drop in the full prompt from the accordion above:
```ts theme={null}
import { ContextClient } from "@ctxprotocol/sdk";
const client = new ContextClient({ apiKey: process.env.CONTEXT_API_KEY });
const result = await client.query.run({
query: "Read the order flow on BTC using Crypto Data over the last 7 days at 1h granularity...",
responseShape: "answer_with_evidence",
includeDataUrl: true,
});
console.log(result.response); // grounded verdict
console.log(result.dataUrl); // rendered dashboard + full dataset
```
Your agent pays per response in USDC. No subscription, no KYC, no invented
numbers.
Drop the Lite MCP into your agent in one config block.
See the full architectural story behind the grounded answer above.
### The real 48-hour metrics
| Metric | Value |
| ------------------------- | ---------------------------------- |
| 48h price change | **+0.01%** (effectively flat) |
| 48h OI change | **−4.35%** (contracting) |
| Avg funding (48h) | **+0.0069%** / 8h |
| Latest funding | **+0.0056%** / 8h |
| Liquidation imbalance | **−\$219M** (sell liqs ≫ buy liqs) |
| Spot CVD adj. slope (24h) | **+\$8.67M/hr** |
| Perp CVD adj. slope (24h) | **−\$0.66M/hr** |
### The grounded read
* **Regime (OI matrix):** flat price + falling OI + below-average volume lands
on **weak uptrend / short-covering**, not the new-money strong uptrend a
bullish squeeze would need.
* **Absorption:** spot CVD trending up (+\$8.67M/hr) while perp CVD is
flat-to-negative = real **spot absorption** of perp-driven selling.
* **Who's trapped:** earlier shorts are under pressure (−\$219M sell-liq
imbalance, funding still positive), but mid-week longs are exposed because OI
is *declining*, so no fresh margin confirms the move.
> **Verdict: Neutral / Mixed: lean cautiously bullish on absorption, but wait
> for confirmation.** Watch for a reclaim of local highs with *simultaneous OI
> expansion* and funding dipping toward zero. Until then, this is a
> wait-and-confirm environment, not a high-conviction entry.
*Data: Crypto Data, 7-day 1-hour aggregate across Binance, Bybit, OKX,
Hyperliquid, Deribit (perps) and Binance, Bybit Spot, OKX, Coinbase (spot).*
***
## What this shows
Gemini had no feed, so it trusted the prompt's "steady OI climb" and built a
bullish squeeze thesis on top of it. The reasoning was clean; the foundation
was assumed.
Context pulled the live data, found OI was actually down 4.35%, and the
verdict changed. The data is the deliverable, including the chart you can
act on.
***
## Try it yourself
The grounded answer above came from the same public SDK surface your agent can
hit today. Drop in the full prompt from the accordion above:
```ts theme={null}
import { ContextClient } from "@ctxprotocol/sdk";
const client = new ContextClient({ apiKey: process.env.CONTEXT_API_KEY });
const result = await client.query.run({
query: "Read the order flow on BTC using Crypto Data over the last 7 days at 1h granularity...",
responseShape: "answer_with_evidence",
includeDataUrl: true,
});
console.log(result.response); // grounded verdict
console.log(result.dataUrl); // rendered dashboard + full dataset
```
Your agent pays per response in USDC. No subscription, no KYC, no invented
numbers.
Drop the Lite MCP into your agent in one config block.
See the full architectural story behind the grounded answer above.